Visualization of the cross section of the CO-1 sample in the digital focusing mode of the antenna (UFA) using complex signals
The task
In order to demonstrate the possibilities of visualizing defects in objects with a high absorption coefficient, a series of experiments with the visualization of reflectors in a sample of CO-1 was carried out in the laboratory for the use of the SPC ECHOPLUS Company.
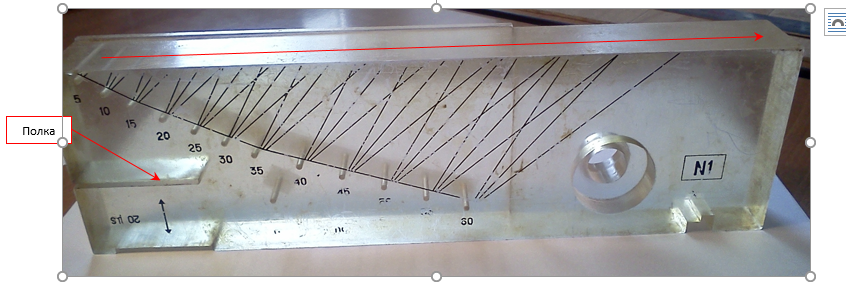
The picture below shows a photo of the CO-1 sample made of plexiglass. The red arrow shows the line along which the antenna array was scanned.

Equipment and object of research
Scanning was performed using an AUGUR-ART flaw detector and a stepper motor scanner. Measurements were performed at 120 positions with a step of about 2 mm.
The amplitude of the probing signal is about 50 volts. The radiating electronics of the AUGUR-ART system are capable of emitting complex signals (phase-manipulated and linear frequency-modulated).
After scanning, the antenna was processed by digital focusing with scanning (CFA-X).
The result of visualization in the CFA mode
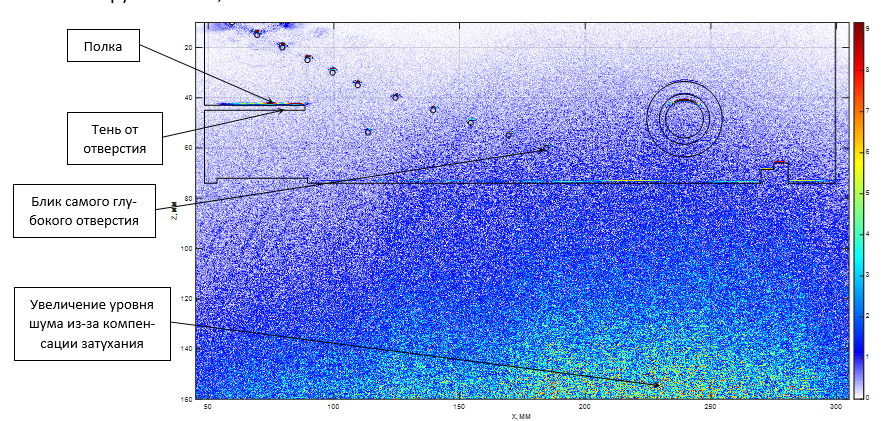
The figure below shows a CFA image reconstructed from echo signals with compensated absorption of 0.02 1/mm. The image contrast is 0.1. This means that when the pixel amplitude exceeds 10% of the maximum of the image, the pixel is shown in red.
It can be seen that the frontal resolution practically does not depend on the depth and approaches the size of the plate, that is, 0.5 mm.

The result of visualization in the CFA mode with compression of complex signals
The registration of complex echo signals using the AUGUR-ART system occurred as follows. Twenty sets were calculated, each of which had 32 pseudo-orthogonal signals used in CDMA technology. The echo signals were measured in the FMC (double scan, CFA) mode, but only each element was assigned its own code signal (complex signal).
The purpose of using complex signals is to increase sensitivity, as well as to significantly reduce the time of data collection by an order of magnitude by reducing the number of radiation-reception cycles by a phased array.
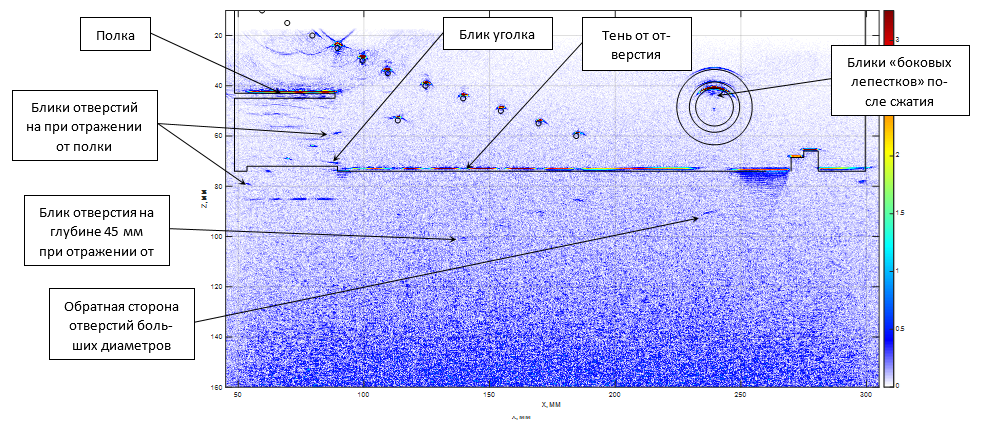
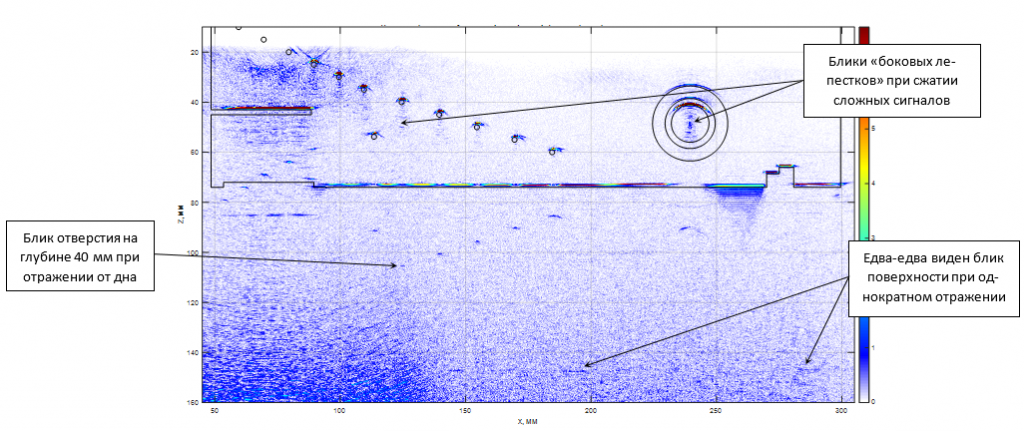
The figure below shows a CFA image reconstructed from echo signals with compensated absorption of 0.02 1/mm, which were "compressed" using consistent filtering. The image contrast is still 0.1. There are no highlights of the holes closest to the surface, since the echo signals were considered in the range from 20 to 150 microseconds. With a code length of 15 periods, the length of the probing pulse is 3.0 microseconds, which leads to an increase in the size of the "dead zone". The glare of the upper surface of the sample with a single reflection from the bottom is not visible, but the glare of the hole at a depth of 45 mm with a single reflection from the bottom has become discernible. Compared to the image in Fig. 2, the signal-to-noise ratio has increased by about 10 dB.

A further increase in the number of pulses in complex signals leads to an even greater increase in the signal-to-noise ratio.

Conclusion
- The effectiveness of visualization of the internal cross-section when using CFA-X processing, when using the AUGUR-ART flaw detector is shown.
- It is advisable to use absorption compensation to equalize sensitivity throughout the image