TOFD control method
APPLICATION OF TOFD TECHNOLOGY IN THE DEVELOPMENTS OF THE ECHOPLUS COMPANY
A.E. Bazulin, A.V. Butov, D.S. Tikhonov, S.V. Romashkin, A.V. Zaushitsyn
Since the establishment of LLC "SPC "ECHO+", special attention has been paid to ultrasound control methods that provide visualization of images of defects and measurement of their sizes. Diffraction methods, due to their high sensitivity and high accuracy, in many cases allow us to solve the problem of detecting, classifying and determining the parameters of defects. This article provides an overview of the capabilities of the equipment and software developed by LLC "NPC "ECHO +" in order to implement the TOFD technology.
Basics of the TOFD method
The technology of the diffraction-time method (Time of Flight Diffraction) was worked out in detail in the 1970s in the UK and brought to a widely used industrial standard, many tests were carried out, the replacement of radiographic control with the TOFD method was justified [2, 3, 4]. Methods using diffraction signals were used in the equipment of LLC "NPC "ECHO+" since the establishment of the company [5, 6]. At the same time, the use of the TOFD method in Russia has been hindered for a long time by the lack of a regulatory framework and quality assessment standards.
Figure 1 shows an illustration of the principle of data collection using TOFD technology and an example of a data file showing an identified planar defect (non-edge).
TOFD technology in the control of butt welded joints implies the use of:
- operating in a separate mode, providing a short (no more than two periods) probing pulse;
- a low-noise amplifier with a large gain range in order to register diffraction signals that can be 20 dB lower than the reflection from the side hole;
- high frequency of digitization of the radio signal (8 times higher than the operating frequency of the converter);
- special software with cursors that make it possible to analyze the phase and time of arrival of the signal.
The main advantages of TOFD technology:
- high sensitivity to defects of various types, from individual pores to cracks of various orientations;
- the speed of control is limited only by the frequency of sending a probing pulse, which is especially convenient for monitoring thick-walled welded joints;
- the ability to measure dimensions – many tests were carried out on pearlite welded joints, which showed height measurement errors of fractions of a millimeter;
- there is practically no dependence of the setup procedure and data analysis depending on the shape of the welded joint.
- data recording and interpretation in offline mode, which allows you to document the results of the control.
Fig. 1. The TOFD principle and an example of detecting a vertically oriented planar defect
Disadvantages of TOFD technology:
-
the inability to measure the equivalent area of the identified defects;
-
the need for two-way access to the welded joint;
-
uncertainty in the discontinuity coordinate in the direction perpendicular to the axis of the welded joint;
-
difficulties in the control of welded joints using austenitic materials or other materials with high attenuation and granularity;
-
the presence of a dead zone at the outer surface, the complexity of interpreting signals from defects in the bottom surface area, especially against the background of edge displacement;
-
the need to train a qualified operator trained on a representative sample of typical defect images.
The API RP 2X document [7] does not recommend the use of TOFD exclusively for measuring discontinuities, but requires the addition of an echo method. The GAZPROM SRT project being developed for the control of welded joints [8] involves the use of parallel control technologies FR (phased arrays) and TOFD in an automated mode.
ASME allows the use of TOFD using phased arrays[9], in the experience of LLC "SPC "ECHO+" there is an example when the control of the root of a welded joint for the presence of washouts was performed using a flaw detector on phased arrays [10].
Implementation in AUGUR systems
Electronics
The flaw detectors of the AUGUR-T and AUGUR-TF systems have integrated boards that implement six- and two-channel versions of TOFD. The sampling rate is up to 100 MHz, with interpolation up to 400 MHz.
Since the diffracted echo signals have a rather small amplitude in comparison with the signal from the bottom surface, especially when using long high-frequency cables (more than 7 m), a low-noise 40 dB preamplifier is used.
Bandpass filtering on a user-configurable frequency band allows you to get less noisy scans, hardware averaging of signals (up to 16 implementations per channel) allows you to increase the signal-to-noise ratio if necessary, but at the expense of slowing down the data collection rate.
Thus, TOFD in AUGUR systems is implemented for both automated and mechanized ultrasonic control options, using a portable battery-powered device.
Converters
Piezoelectric converters with frequencies of 2, 5 and 10 MHz produced by the ECHOPLUS (Fig. 2, Table 1) or other manufacturers are used to conduct the TOFD method in a wide range of thicknesses of control objects from 8 to 300 mm (and even more).
Table 1 – Parameters of the TOFD PEP manufactured by the ECHOPLUS Company
|
Marking and article number |
Frequency, MHz |
Piezoelectric element diameter, mm |
The diameter of the PEP case, mm |
|
L2D0-12C (P0180005) |
2 |
12 |
17 |
|
L5D0-03C (P0180002) |
5 |
3 |
9,5 |
|
L5D0-06C (P0180001) |
5 |
6 |
9,5 |
|
L10D0-03C (P0180003) |
10 |
3 |
9,5 |
|
L10D0-06C (P0180004) |
10 |
6 |
9,5 |
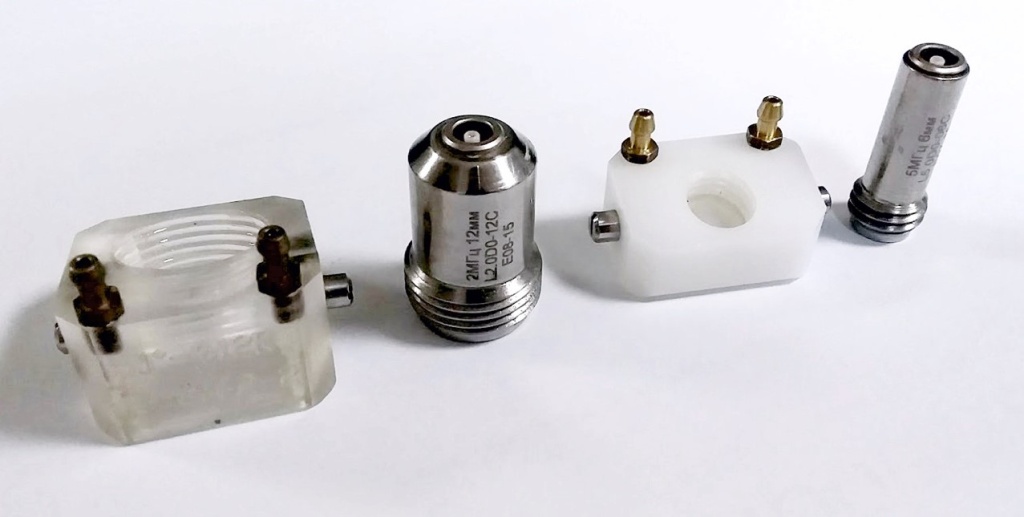
Fig. 2. Prisms and PEP TOFD manufactured by the ECHOPLUS Company
Scanners
To move groups of TOFD converters, it is possible to use various scanning devices, from the simplest and miniature, to large scanners carrying up to 8 pairs of TOFD. Figure 3 shows three scanners for TOFD: a manual CHAMELEON, a mechanized MOUSE and an automated ELEPHANT. The main requirement is the minimization of backlash in the mechanisms of attachment of converters. In the arsenal of LLC "NPC "ECHO +" there are all types of such scanners. Practice, however, has shown that the most convenient option is when no more than two pairs of TOFD are installed on the scanner, otherwise operational tracking of the acoustic contact and reaction to the deterioration of the acoustic contact becomes difficult.
Fig. 3. Scanners manufactured by LLC "SPC "ECHO+" for monitoring using TOFD technology (manual, mechanized and automated)
Software
TOFD Calculator
To calculate control schemes, the AUGUR software has a built-in TOFD control scheme calculator (Fig. 4), which allows:
- параметрически задать конструкцию сварного соединения (кольцевое, продольное, сварка разнотолщинных деталей и детали обечайка-днище);
- автоматически подобрать схемы контроля для нескольких пар преобразователей и призм с типовыми значениями размеров пьезопластин, частот, углов ввода продольной волны;
- рассчитать зону прозвучивания сварного шва и околошовной зоны по выбранным схемам контроля;
- рассчитать размерные критерии приемки (соотношение высоты и протяженности для внутренних и поверхностных дефектов), например, в соответствии с Кодовое дело 2235 раздела VIII ASME по ультразвуковому исследованию сварных швов вместо рентгенографии [11].
Fig. 4. Operation of the TOFD parameter calculator (graphical specification of the control scheme, channel parameters and dimensional criteria)
Calibrating cursors
By default, the depth scale on the TOFD scanner is non-linear, which makes data analysis difficult. To link the depth scale to the true depth, it is necessary to calibrate by the signal of the head wave and the signal from the bottom surface of an object with a known thickness. In the AUGUR software, such calibration is performed in a few mouse clicks with manual indication of the signal from the head wave and from the bottom signal. In the near future, such calibration will be fully automated.
Applying Interpolation
The AUGUR software has a built-in TOFD data interpolation function in order to get a smoother picture. Interpolation is applied by applying a fast Fourier transform and increasing the length of the vector by 2-4 times [12]. The example in Figure 5 shows a fragment of the TOFD image before and after interpolation from 40 MHz to 160 MHz. A parabolic cursor mounted on an unstrained defect is also shown.
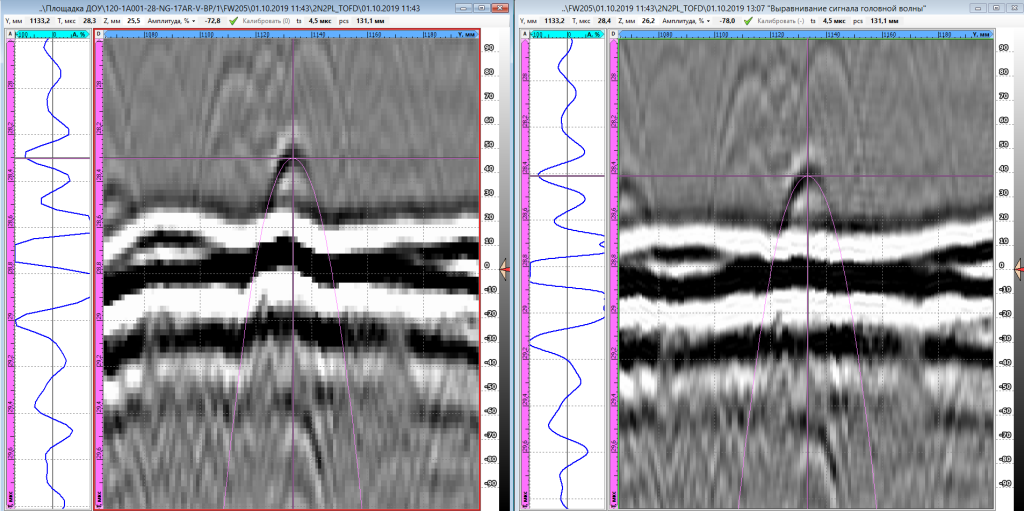
Fig. 5. Application of interpolation (40 MHz frequency on the left, 160 MHz on the right).
Alignment according to the head wave
Compensation of the changing layer of the contact fluid under the prism and mechanical backlashes in the clamp design is performed when processing is called that aligns all signals along the front of the head wave. Figure 6 shows an example of the application of such processing.
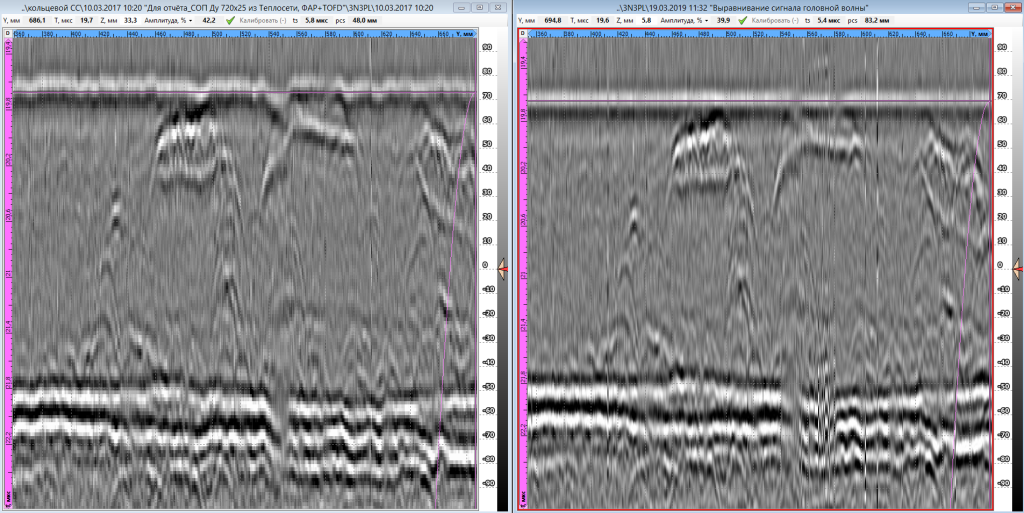
Fig. 6. Alignment according to the signals from the head wave (on the left – initial data, on the right – processed)
SAFT for TOFD
As already mentioned, by default, the depth scale is nonlinear, and the wide directional pattern of the TOFD probe leads to the appearance of characteristic parabolic "whiskers" (Fig. 5). To bring the coordinates to Cartesian, as well as to visually classify defects into extended and non-stretched, processing of the type of frontal SAFT is used. Figure 7 shows an example of such processing when visualizing side holes and a groove in a tuning sample.
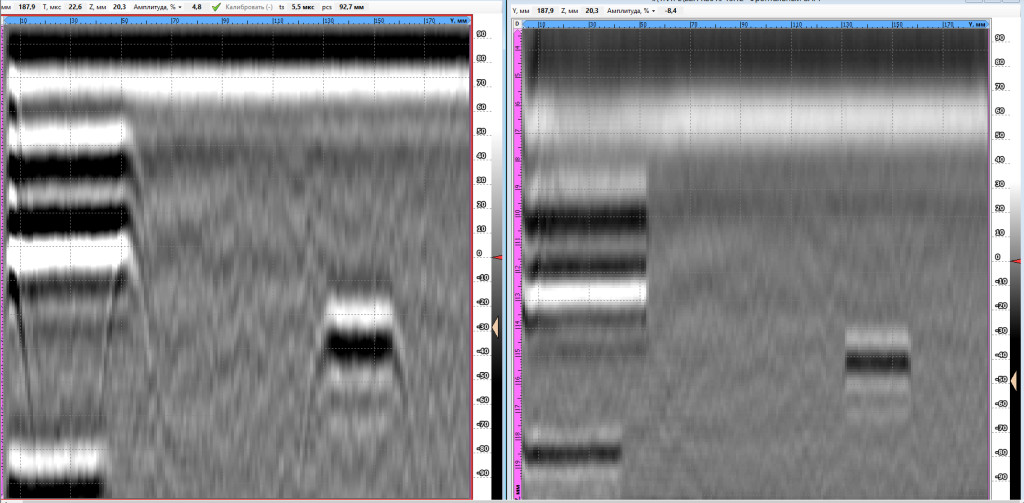
Fig. 7. SAFT processing for TOFD data (on the left – initial data, on the right – processed)
Coherent factor
It is possible to reduce the level of false blocks of the bottom image and reduce the size of the dead zone using the coherent factor (CF) method [13]. Figure 8 shows fragments of a SAFT image and a SOFT-CF image of a sample of a welded joint of steam generator shells with a thickness of 145 mm. The highlights of the boundaries of the groove simulating a subsurface crack have retained the phase ratios of TOFD echoes and are in antiphase. On the SOFT-CF image, the glare of the top of a vertical flat-bottomed hole with a depth of 5 mm and a diameter of 5 mm made on the bottom surface is confidently detected, the extent of both defects is determined to be close to the actual one.
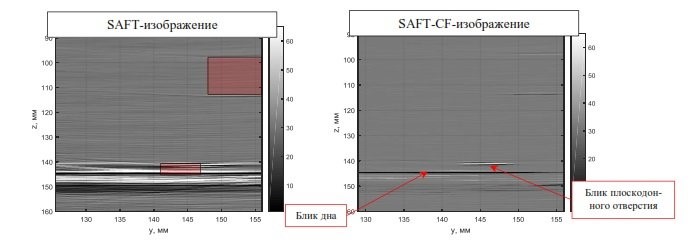
Fig. 8. An example of the use of a coherent factor to reduce the size of the dead zone when detecting bottom defects
Databases with albums of defects
Due to the peculiarities of the TOFD data, the operator is required to check his vision for the ability to distinguish gray gradations and the skill of deciphering data obtained on various types of defects. To prepare operators, it is required to look at a significant amount of such data. The principle of building the AUGUR database allows you to select from it TOFD data obtained at various control objects, both containing defects and defect-free.
Methods of application
ДFor the application of TOFD technology, a number of control methods have been developed and tested at the ECHOPLUS Company, including:
- For control of welds of main gas pipelines [14];
- To control the welds of the onshore section of the Nord Stream-2 pipeline [15];
- To control the welds of vessels with a wall thickness from 12 to 300 mm [16].
The methods are developed taking into account the requirements of international and Russian standards and include requirements for equipment, tuning samples, the procedure for setting up, monitoring and analysis of control data.
Application examples
Control of annular welds of pipelines
The forces and equipment of the ECHOPLUS Company carried out control of welded joints of pipelines:- diameter from 159 to 720 mm on the onshore section of the Nord Stream–2 pipeline (Fig. 9);
- diameter from 426 to 1420 mm during testing of the AUGUR-TF system at Gazprom VNIIGAZ LLC
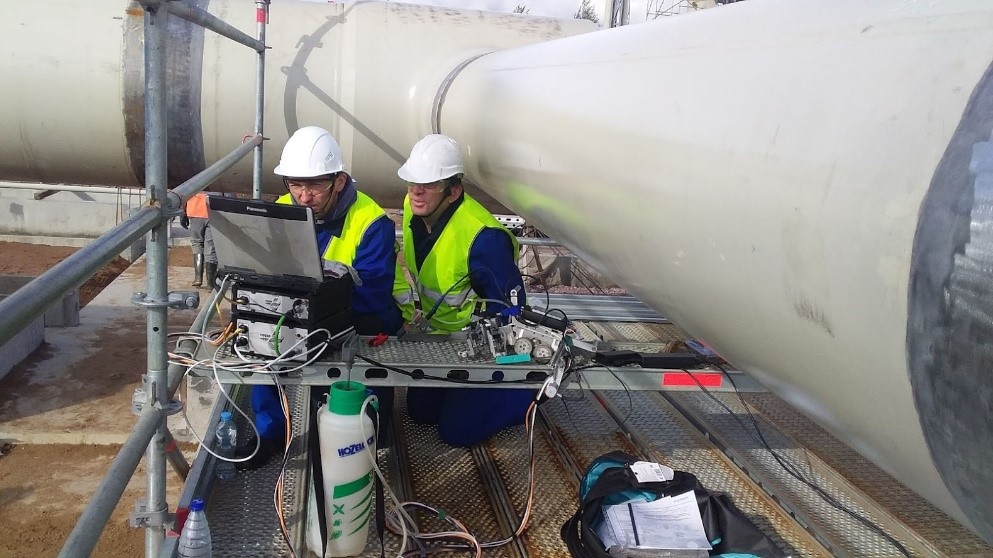
Fig. 9. Control by the AUGUR-T F (FR+TOFD) system of annular welded joints of pipelines
Control of vessel welds
With the use of equipment of the ECHOPLUS Company, vessels and containers with a thickness of up to 350 mm were monitored, produced by JSC "Izhorskiye Zavody", JSC "Uralkhimmash" (Fig. 10), JSC "Krasny Kotelshchik" and containers operated at the Omsk refinery.
Fig. 10. Control of welded joints of vessels. Movement of a mechanized scanner and a scanogram through two TOFD channels
Corrosion control at the root of the seam
The laboratory for the use of equipment of the ECHOPLUS Company conducted a demonstration control of a test test sample of a welded joint with wear defects of the seam root. The sample was cut from a pipe rejected according to thickness measurement data and contains real defects that were formed as a result of leaching of the seam root by the working medium (Fig. 11). Figure 12 shows a characteristic view of the TOFD image obtained by scanning a sample with a Car Mouse scanner with an A2×2 TOFD preamplifier (art. S0170002). During the measurements, a control circuit with a TOFD probe with a frequency of 5 MHz and prisms with a 70 ° angle of insertion into steel was used. The TOFD image shows the bifurcation of the bottom signal, which indicates a decrease in thickness in the region C. Defects 1 and 2 according to the ASME classification are a concave root.
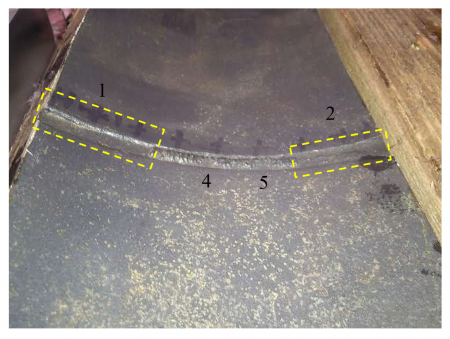
Fig. 11. View of the sample with a blur, view from the root side
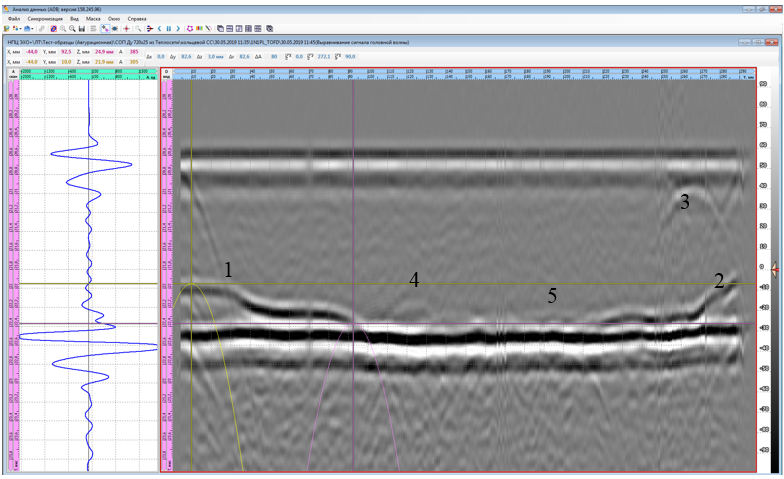
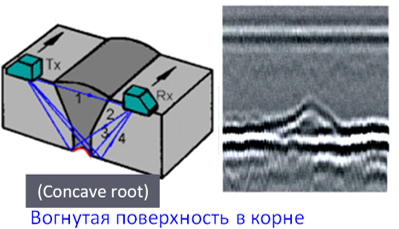
Fig. 12. An example of detecting blurring (indications 1 and 2) at the root of the seam and the type of defect according to the ASME classifier
A comparison of the heights of washouts No. 1 and No. 2, measured according to TOFD data and using VIC, is shown in Table 2. The difference in the results did not exceed 0.2 mm. In the TOFD image, point defects in the root of the seam (4 and 5) are also faintly visible, which are also visually detectable.
Table 2 – Results of measurements of the parameters of the recesses
|
№ defect |
Maximum recess depth, mm
|
|
|
TOFD |
ВИК |
|
|
1 |
3,0 |
2,9 |
|
2 |
4,2 |
4,0 |
Asymmetric TOFD
If it is impossible to install the TOFD probe symmetrically due to the presence of cone ducts, the presence of bends and other things (which, unfortunately, occurs in some cases, especially during operational control), the so-called asymmetric TOFD can be used when one of the sensors is installed in the middle of the seam and receives (emits) a longitudinal wave at an angle of 0° or close to this. In the Russian literature, this is called the delta method [17]. In this mode, the head wave signals are significantly weakened or completely absent, but the results for detecting defects are no worse than with classical TOFD. The AUGUR Control Scheme Calculator also supports this control scheme (Fig. 14).
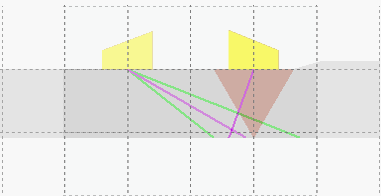
Fig. 14. Example of calculation of the "asymmetric TOFD" scheme
Detection of transverse defects
The peculiarity of the TOFD technology does not allow to distinguish a single non-tensioned defect of the pore type from a real transverse crack without special tricks. Theoretically, the problem of distinguishing an unstrained defect from a transverse one can be solved in the presence of a second data acquisition channel, when a pair of TOFD PEP is deployed along one line by 45°[18]. In this case, by changing the characteristic shape of the "mustache" when changing the scheme, it is possible to diagnose the presence of a transverse defect, and then finally confirm it by another control method (for example, simply by the echo method). The difference in the mentioned shape change is insignificant and in the real case it is difficult for the operator to identify this difference. In addition, when monitoring small-diameter pipes, it is difficult to place the TOFD PEP according to the scheme with a turn. However, as signals from such defects accumulate, there is every reason to believe that a certain algorithm from the field of machine learning will be used to classify by type of defect.
Identification and determination of the form of austenitic welding
Identification and determination of the austenitic welding form
Fig. 15. Example of determining the shape of austenitic repair welding (image obtained by DEKRA). The cursors are set to the beginning and end of welding. It is seen that the welding reaches a layer of clad metal.
Conclusions
The TOFD method, developed in the 1970s, continues to demonstrate its effectiveness in monitoring various objects.
The use of equipment (flaw detectors, scanners, piezoelectric converters, prisms, tuning samples) and AUGUR software developed by ECHO+ SPC LLC allows you to implement all components of TOFD technology and ensure the detection and determination of defect parameters in the welds of hazardous industrial facilities.
Albums of images of typical defects are of great value. Each of the companies performing work on the AUZK accumulates characteristic images of defects obtained on test samples and real defects confirmed by the results of clipping. The AUGUR database is constantly updated with such images for training flaw detectors of the ECHO+ laboratory, and Customer specialists.
Promising results were obtained with the automatic analysis of TOFD data with the definition of the type of defect [20], in the plans of LLC "SPC "ECHO+" to apply machine learning methods to such data.
Literature
- Silk, M.G., Lidington, B.H., Determining the size of defects using the ultrasonic time delay method, British Journal of Non-Destructive Testing, March 1975, pp. 33-36.
- ISO 16828:2012 Non-destructive testing. Ultrasonic control. Diffraction -time method as a method for detecting and estimating the size of discontinuities.
- ISO 10863:2011 Non-destructive testing of welded joints. Ultrasonic method. Application of the diffraction-time method (TOFD).
- Verkooijen, J., "TOFD is used to replace radiography", INSIGHT, volume 37 (6), pp. 433-435, June 1995
- Badalyan V.G., Bazulin E.G., Vopilkin A.H. and others. Ultrasonic flaw detection of metals using holographic methods. / Edited by A.H. Vopilkin – M: Mechanical Engineering, 2008. – 386 p.
- Bazulin E. G., Vopilkin A. H., Tikhonov D. S. The use of diffraction waves for ultrasonic flaw detection in algorithms for coherent reconstruction of high-quality images of reflectors // World of Non-destructive Testing, 2012, No. 3 (57), pp. 20-25
- API RP 2X. Recommended practice of ultrasonic and magnetic control of the manufacture of marine structures and recommendations for the qualification of technical specialists.
- STO Gazprom 15-1.3-004-2019 Welding and non-destructive testing of welded joints. Non-destructive methods of quality control of welded joints of field and main gas pipelines
- K. Brillon, T. Armitt, O. Dupuy. TOFD verification using phased arrays. 17th World Conference on Non-Destructive Testing, October 25-28, 2008, Shanghai, China
- Bazulin A.E., Pronin V.V., Tikhonov D.S., Benitez H., Schnell O.O. Continuous ultrasonic thickness measurement of the base metal and welds. In the world of NK, No. 4 (66), 2014, from 20-26.
- ASME Section VIII Code Case 2235 on ultrasound examination of welds instead of radiography
- Bazulin A.E. Calibration system of ultrasonic piezoelectric transducers AUGUR 5.4. Part II. Measurement errors // Control. Diagnostics. – No. 3. – 2010. – ss. 8-20.
- Bazulin E.G. Using the coherence coefficient to improve the image quality of reflectors during ultrasound control // Flaw detection. 2017. No. 6. pp. 5-17
- MFART-NG1-T1-A/24-K-16. Instructions for automated ultrasonic inspection of welded joints of gas pipelines with a wall thickness from 8 to 40 mm by the AUGUR-TF automated ultrasonic inspection system
- W-RU-PIP-ONR-PRO-878-000556ER. Nord Stream-2. CONSTRUCTION OF THE GROUND SECTION OF THE PIPELINE IN RUSSIA is a procedure of mechanized ultrasonic control using phased arrays and TOPD. Pipelines.
- MTOFD-NHP-TS1A-20-KP-17. Automated ultrasonic inspection of welded joints with a thickness of 12 to 300 mm by the diffraction-time method of TOFD. Instructions for conducting control.
- Shcherbinsky V.G., Alyoshin N.P. Ultrasonic inspection of welded joints. Moscow: Publishing House of Bauman Moscow State Technical University, 2000. 496 p.
- Dr. Lewis L. Morgan. Transverse cracking during manual and automated ultrasonic inspection of welds.
- George Benitez, Zhidrus Viljunas. Automated ultrasonic inspection of welded joints of the DN800 circuit of multiple forced circulation of RBMK reactors. The mission of technical support of WANO NPP. Moscow, August 10-11, 2011
- Shekhar N Shitole, O Zahran, In Al-Nuaimi, combining fuzzy logic and neural networks in the classification of weld defects using ultrasonic time-of-flight diffraction. NDT 2006, 45th Annual British Non-Destructive Testing Conference, Stratford-upon-Avon, UK, September 2006.