Ultrasonic inspection of two samples of polyethylene pipes using PWI technology
Goal
Conducting ultrasonic inspection (ultrasound) of two samples of thick-walled pipes made of high-pressure polyethylene using Plane Wave Imaging (PWI) technology and combining partial images using coherent factor (CF) technology in order to increase the signal-to-noise ratio.
Registration of echo signals
To register echo signals, the AUGUR ART CFA flaw detector was used, developed and manufactured by the ECHOPLUS Research and Production Center for Non-Destructive Testing. The echo signals were recorded by an antenna array (AR) (2.25 MHz, 20 elements, the size of the piezo element is 1.1×10 mm, the gap between the piezo elements is 0.1 mm) mounted on a plexiglass prism with an inclination angle of 20 degrees. Echo signals were recorded when scanning the AR across the welded joint and the image of the reflectors was restored taking into account all the positions of the AR (triple scan mode). This method of image reconstruction of reflectors allows to increase its transverse resolution and reduce the noise level.
Noise reduction
To reduce the level of structural noise, in addition to the well-known reception associated with a decrease in pulse duration due to mathematical processing of echo signals, you can use the following method. Let AR be at the point rw denoted by Im (ri; rw). CFA is the image restored at the specified points ri. OVI by shot number m, that is, by echo signals measured by all AR elements when emitted by element number m. Then the usual CFA image can be obtained by coherently adding up all the images by shots

(1)
where Ne the number of AR elements. But combine partial boost images Im (ri; rw) it is possible in other ways. For example, you can calculate the coherent factor for each point ri enhancement images according to the formula

(2)
and as a restored image, consider the function

(3)
An important property of the coherent factor is that in the absence of noise, the amplitudes of the CF glare of the reflectors are equal to one. Therefore, the amplitudes of the image highlights obtained by the formula (1) or (3) will be approximately the same. In the triple scan mode, when the AP scans, the final image can be obtained using formulas (1) or (3), but as partial images will be used Np images Is (ri; rw) or I (ri; rw), restored for each AR position

(4)
47 mm thick sample
The photo below shows a 47 mm thick sample in which three flat-bottomed holes (PDO) with a diameter of 1, 2 and 4 mm were drilled to a depth of 6 mm. Echo signals were recorded in 70 positions of the antenna array when moving it along the outer surface of the sample with a step of 0.9884 mm.

The figure below shows the installation and the test sample. The antenna array is in the initial position of the scanning aperture. The scan line is shown by a red arrow.
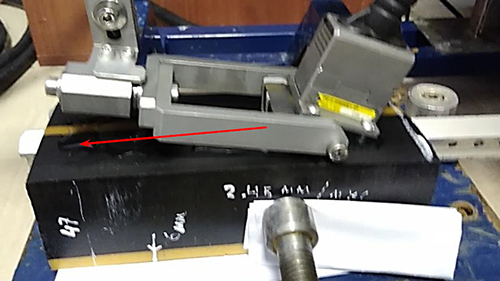
Figure 1 shows the combined image as a coherent sum obtained by formulas (1) and (4), on which the highlights of all three PDO are confidently detected.
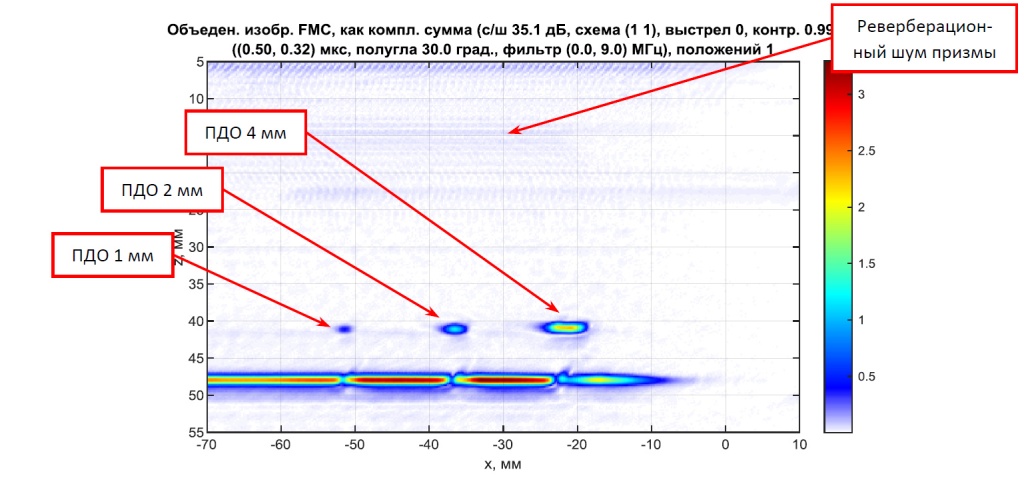
Figure 1
Figure 2 shows the combined image, but not as a sum of partial images, but taking into account the coherent factor according to formulas (3) and (4). The signal-to-noise ratio has increased by about 5 dB, and the "surfacing" boundary (the boundary between black and brown materials) has become more noticeable.
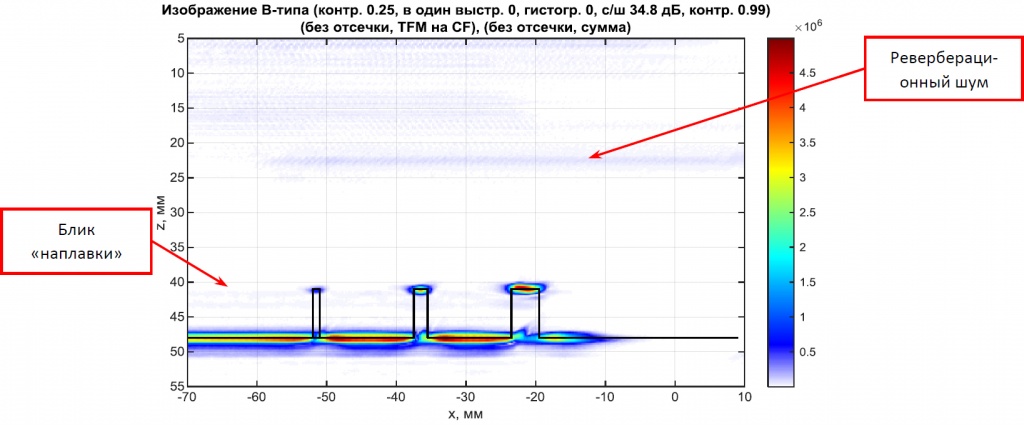
Figure 2
Registration of echo signals in PWI mode
The registration of echo signals in the PVE mode implies the emission of a plane wave into the object of control, as it happens in the phased array mode (FAR), and the echo signals are recorded by all elements of the AR. Usually a set of several plane waves with different input angles is used.
Figure 3 shows PWI echoes on the left, and FMC echoes on the right. On the PWI echo signal, the echo signals from the remote control with a diameter of 1 mm and the echo signals from the input holes of all the subs are clearly visible.
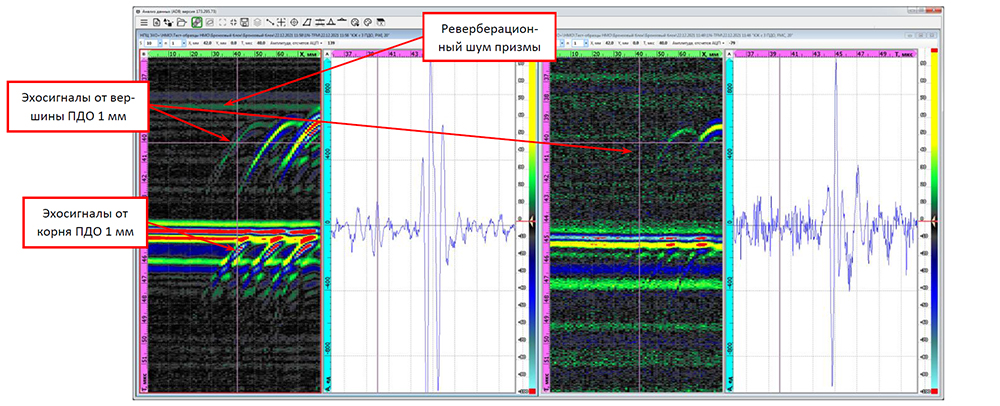
Figure 3
Figure 4 shows the combined image, as a coherent sum according to formulas (1) and (4), on which all PDO are revealed. In comparison with Fig. 1, the glare of the "surfacing" border has become more noticeable.

Figure 4
Figure 5 shows the combined image, but not as a sum of partial images, but taking into account the coherent factor according to formulas (3) and (4). The signal-to-noise ratio has increased by about 5 dB.
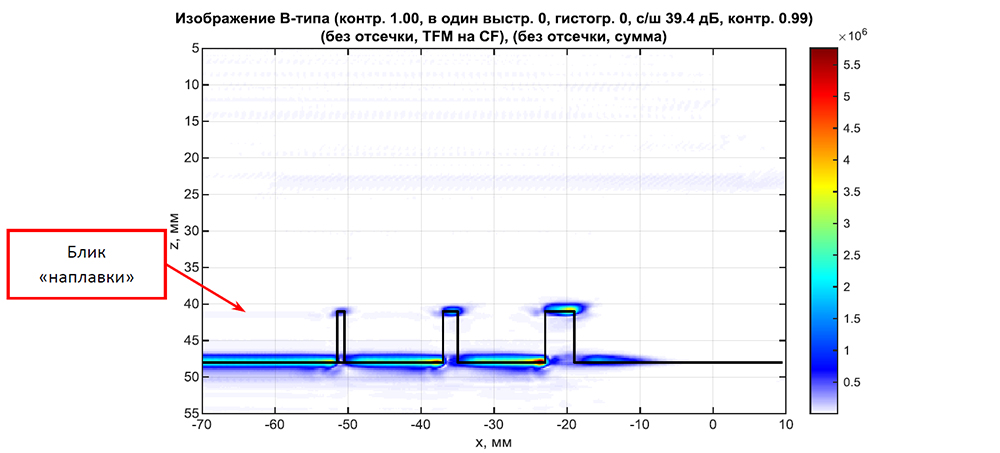
Рис. 5
120 mm thick sample
In a 120 mm thick sample, 5 lateral cylindrical holes (BTS) with a diameter of 3 mm were drilled (Fig. 6, left). The surface of the sample is uneven (Fig. 6, right).
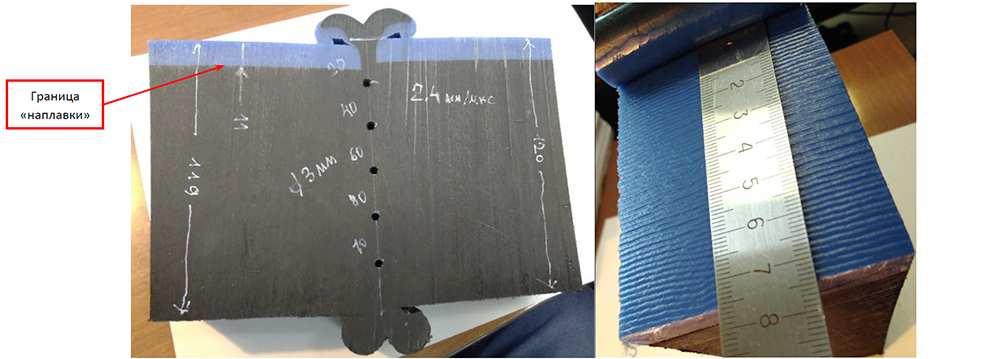
Figure 6
Figure 7 shows a photo of the root of the welded joint, on which the points L and R are indicated.
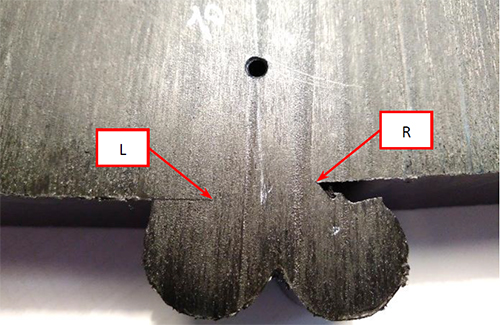
Figure 7
The photo below shows the sample and the AR at the beginning of the scan. The scanning direction is indicated by a red arrow. Echo signals were recorded in 35 positions of the antenna array when moving it along the outer surface of the sample with a step of 0.9884 mm.
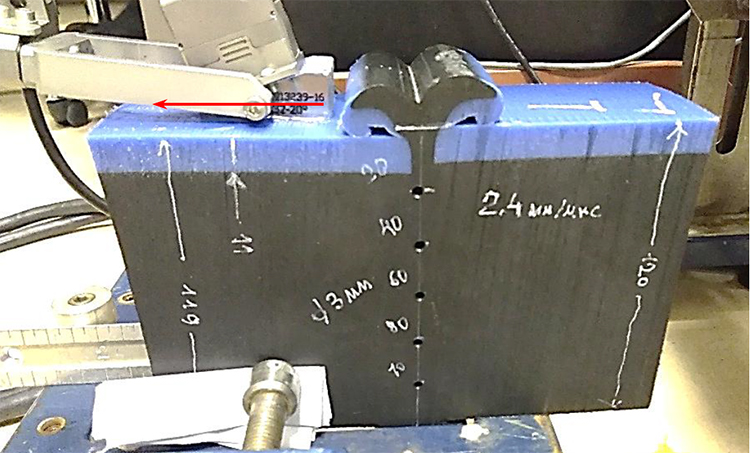
Registration of echo signals in FM mode
Figure 8, on the left shows the image combined as the sum of partial images according to formulas (1) and (4), and on the right its fragment, on which the "surfacing" border (the border between black and blue materials), the glare of an uncluttered reflector and a suspicious area with low-amplitude glare are visible. The glare of the BTS, with the exception of the uppermost one, can be detected in the restored image. The fact that it was not possible to see the glare of the uppermost BCO is explained by the fact that the velocity of the longitudinal wave of the prism material is 2.7 mm / mks, and the velocity of the longitudinal wave in high-pressure polyethylene is about 2.4 mm / mks. Therefore, the maximum angle of entry into the pipe is 58 degrees. Choosing a different material for the prism, for example, textolite, will allow ultrasound to be injected into the tube at large angles.

Figure 8
Figure 9 shows the combined image, but not as a sum of partial images, but taking into account the coherent factor according to formulas (3) and (4). The signal-to-noise ratio increased by about 8 dB, but the amplitude of the glare of the deepest BCO decreased.
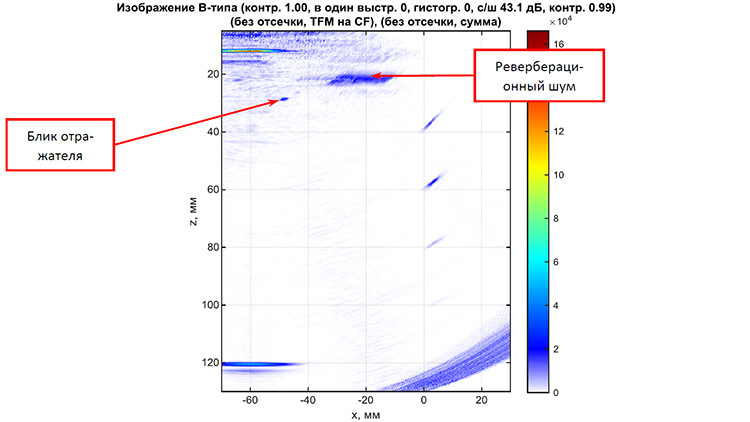
Рис. 9
Registration of echo signals in PWI mode
Fig. 10 shows the combined image, as a coherent sum according to formulas (1) and (4), on which all BTS are revealed, except for the upper one. In comparison with Fig. 8 on the left, the amplitude of the glare of the BTS has increased significantly. However, the uneven border of the sample surface (Fig. 6, right) led to the appearance of false highlights in the image. They arose due to the fact that the probing pulse is repeatedly dispersed on irregularities filled with glycerin, which was used as a contact fluid.
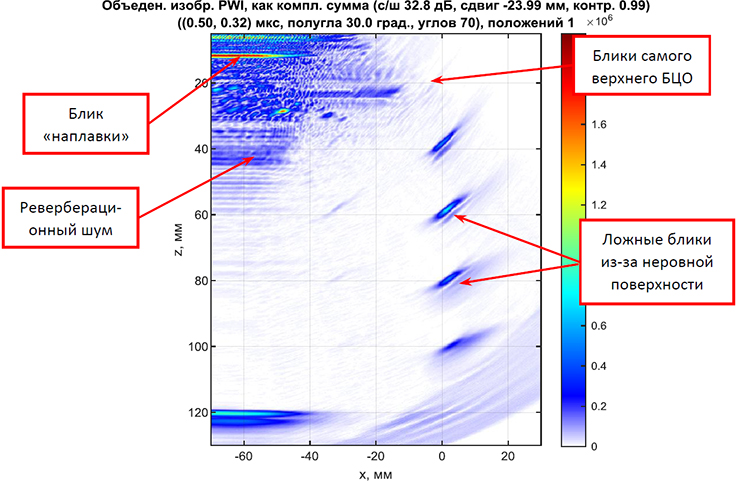
Figure 10
Figure 11, on the left shows the combined image taking into account the coherent factor according to formulas (3) and (4). The signal-to-noise ratio has increased by about 10 dB compared to Figure 10. It can be assumed that the points L and R shown in Fig. 7 are visible in this image. The glare between them is most likely formed according to the acoustic scheme "direct beam – reflector – beam with reflection from the bottom". Such glare is typical for single-element converters or for antenna arrays of small sizes and for large depths. Figure 11, on the right shows a fragment of the image. It confirms the presence of an uncluttered lens and a suspicious area, which are also visible in Fig. 8, on the right.

Figure 11
Conclusions
- Volumetric defects are reliably detected by PWI and FMC methods for two samples under study. The presence of glare points L and R (Fig. 11) suggest that the edges of cracks will be detected using PWI technology.
- The PWI mode for this kind of samples is significantly better than FMC. Attention! The echo signals from the PDO are visible on the PWI echo signals (Fig. 3). Two samples can be controlled at a frequency of 2.25 MHz, but it is advisable to increase the number of AR elements by two or three times. Then it will be possible to abandon the triple scan mode.
- The control can be carried out on an uneven surface (Fig. 6, right). At the same time, the glare of the reflectors does not "fall apart", but false glare appears on PWI images (Fig. 10, left, Fig. 11, left).
- The front resolution on FMC images is slightly better than on PWI images! However, it was possible to see the highlights of points L and R only on PWI images (Fig. 11)
- Special prisms are needed, at least from rexolite, to be able to introduce plane waves into polyethylene samples at angles up to 90 degrees.
- A reflector and an area with suspicious glare were detected in a 120 mm thick sample (Fig. 8, right, Fig. 11, right).
Bazulin E.G.
December 27, 2021
January 22, February 01, 2022
Literature
- [Bazulin E.G., Evseev I.V. Application of Plane Wave Imaging technology in ultrasonic non-destructive testing // Flaw detection. 2021. No.6. pp. 3-16.
- [Bazulin E.G. Using the coherence coefficient to improve the image quality of reflectors during ultrasound control // Flaw detection. 2017. No. 6. pp. 5-17.
- [The official website of the company "ECHO+" URL: http://www.echoplus.ru (date of application: 22.01.2022).
- Ermolov I.N. On the question of choosing the optimal parameters of the echo method of ultrasonic flaw detection // Flaw detection. 1965. No. 6. pp. 51-61.
- [Bazulin E.G., Evseev I.V. Reducing the noise level of the image of reflectors reconstructed from echo signals measured by an ultrasonic antenna array // Russia, Moscow, "XVII International Scientific and Technical Conference of Students and postgraduates "Radioelectronics, Electrical Engineering and Power Engineering", MEI, March 11-12, 2021, p. 303
.
File: pdf / 1.76 MB
Language: Russian Контроль труб из полиэтилена (FMC, PWI) DOWNLOAD